The performance of a dry powder inhaler (DPI) is affected by complex and subtle interactions between the drug substance, excipients and the device used. Arguably this makes DPIs a more challenging generic target than any other pharmaceutical product, as evidenced by the current commercial landscape. Advair, for example, one of the most successful DPIs to come to market, is now off-patent but relatively free of generic competition, despite well-funded efforts by a number of companies to access market share.1
The FDA’s industry guidance for the development of DPIs2 emphasises the importance of particle characterisation. Successful drug delivery with a DPI relies on dispersing particles to a suitable size for deposition in the lung. Particle characterisation helps to elucidate and control the dispersion mechanisms associated with drug delivery, and supports the development of a product with robust aerosolisation behaviour, controlled bioavailability and consistent clinical efficacy. Relevant and efficient particle characterisation strategies are therefore critical in the development of both new and generic products.
A number of analytical techniques to accelerate the separation and identification of the individual components of a formulated DPI are available and this article will focus on the use of Morphologically Directed Raman Spectroscopy (MDRS) in conjunction with cascade impaction to probe the nature of large particles and agglomerates.
Understanding DPIs
The majority of DPIs are classified as passive, with delivery of the dose being driven solely by the inhalation manoeuvre of the patient. As the patient inhales, air is drawn through the device, aerosolising the powder dose and dispersing it to form drug particles of a respirable size. The size of the particles delivered to the patient and the total emitted dose depend on the energy supplied by inhalation being sufficient to disperse the formulation with the chosen device. The FDA draft guidance emphasises how all aspects of the DPI – device configuration, packaging (which can be blister, capsule or bulk reservoir) and the physical properties of the formulation – affect this dispersion process.
The size of the API particles received by the patient directly correlates with bioavailability in the lung
The size of the active pharmaceutical ingredient (API) particles received by the patient directly correlates with bioavailability in the lung. This is why delivered particle size, along with dose uniformity, is a critical parameter for DPI performance. A size range of 1–5µm has been established as optimal for pulmonary delivery but particles in this range tend to be highly cohesive. One of the central challenges of DPI development is to engineer a device/formulation combination that ensures successful dispersion of a cohesive dose using only the energy supplied by the inhaling patient.
In many DPIs, efficient drug delivery is achieved by blending the API with a carrier particle. An alternative strategy is to engineer the particle properties of the API, such as shape, surface charge and roughness, to enable carrier-free delivery. De-formulation of a reference labelled drug (RLD) may therefore call for detailed analysis of a multi-component blend, and/or close scrutiny of the characteristics of the API.
FDA draft guidance highlights size, size distribution, morphological features and the crystal habit of an API as being among the critical quality attributes (CQAs) for DPIs – those parameters that define clinical performance. An important aspect of demonstrating bioequivalence is having a detailed understanding of the way in which critical material attributes (CMAs) of the formulation interact with device parameters to affect these CQAs.
Cascade impaction is the technique specified in both the European and US Pharmacopoeias for measuring the aerodynamic particle size distribution of DPIs
Cascade impaction is the technique specified in both the European and US Pharmacopoeias for measuring the aerodynamic particle size distribution of DPIs. This method size fractionates the dose delivered by a DPI on the basis of particle inertia, which is a function of aerodynamic particle size and particle velocity3. The value of cascade impaction derives largely from its ability to deliver component-specific aerodynamic particle size distribution (APSD), which is obtained through the chemical characterisation of each individual size fraction. High performance liquid chromatography (HPLC) is most usually employed for this purpose. This necessitates dissolution of the sample, meaning that any information about the physical characteristics of particles within a specific size fraction is lost.
The technique highlighted by the FDA guidance for morphological studies within DPI development is microscopy. This is an established technique but it too has limitations when it comes to efficient de-formulation. Conventional manual microscopy is labour-intensive, time-consuming and does not usually distinguish between the different components of a formulation.2
Complementary and alternative analytical techniques that can help to address these issues include laser diffraction, automated image analysis and MDRS, all of which can support and accelerate generic DPI development.
Laser diffraction – real-time monitoring of dispersion behaviour: Laser diffraction is an ensemble particle sizing technique that non-destructively delivers volume-based size distribution measurements across a particle size range of 0.01–3500µm. It is a highly automated and rapid method capable of measuring multiple particle size distributions in seconds. These attributes make laser diffraction highly complementary to cascade impaction.
Laser diffraction measures the particle size of the whole formulation. It does not deliver the component-specific information that cascade impaction provides, but it is far faster and provides valuable particle size data for the various stages of the actuation process. The capacity of laser diffraction for real-time analysis enables the measurement of particle size and concentration profiles for hundreds of device actuations in a single day. The technique can therefore be used to rapidly explore the dispersion behaviour of a DPI formulation and to correlate the effects of CMAs and device parameters with the efficiency of drug delivery.3
Laser diffraction particle sizing provides detailed insight into dispersion dynamics, the efficiency of device emptying and the impact of flow rate on product performance (Figure 1). This information helps with scoping the design space for the product and supports the robust demonstration of bioequivalence.
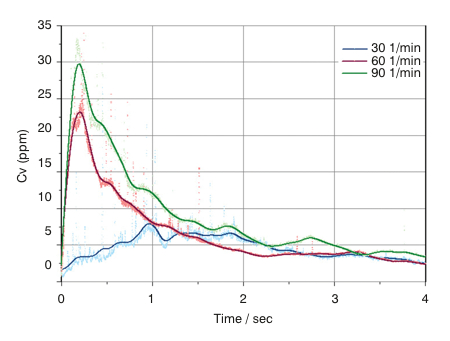
Figure 1: Powder concentration (Cv) vs Time profiles recorded for the emptying of a dry powder inhaler using laser diffraction
The data show that a higher concentration is delivered at high flow rates. This relates to the energy available for aerosolisation of this cohesive formulation
Boosting the informational productivity of cascade impaction: Automated image analysis enables statistically relevant morphological characterisation of a sample in a fraction of the time required to gather far fewer data by microscopy. With automated image analysis, tens of thousands of individual particle images can be captured in a matter of minutes. These are then used to determine morphological parameters for each individual particle to generate size and shape distributions for a sample.
Because automated image analysis is both relatively fast and non-destructive, it can provide morphological information that is beyond the scope of HPLC analysis
Such data support the detailed morphological investigation of a DPI dose, enabling a thorough study of large particles and agglomerates as advocated by the regulatory guidance. Increasingly automated image analysis is, therefore, replacing microscopy for this aspect of DPI characterisation.
In addition, because automated image analysis is both relatively fast and non-destructive, it can provide morphological information that is beyond the scope of HPLC analysis of the size fractionated samples produced by cascade impaction. This strategy enables particle size and shape information to be gathered from various stages of a cascade impactor to develop a deeper understanding of how dispersion proceeds.4
Combining automated image analysis with Raman spectroscopy enables MDRS, further extending this capability. With MDRS it becomes feasible to chemically identify individual particles and gather component specific morphological information for specific size fractions, within a DPI dose.
CASE STUDY
Using MDRS to gain insight into the dispersion behaviour of a DPI formulation containing two APIs
A sample of a commercially available dry powder inhaler containing two API was actuated into a Next Generation Impactor (Copley Scientific, UK) to disperse and fractionate the dose. A collection disk was placed in the collection cup of stage three of the impactor to capture particles on a suitable surface for MDRS. The collected dose was then transferred to a Morphologi G3-ID (Malvern Instruments, UK) for analysis.
The deposited particles were initially characterised by automated image analysis to gather morphological information. From this analysis more than 1,500 particles were then selected for chemical identification on the basis of their size and shape. Raman spectra were gathered for each of the selected particles and compared with a reference library containing spectra of the pure APIs and of lactose, an additional component in this formulation. This enabled secure chemical classification of the particles in the population of interest. A correlation score of 1 indicates that the particle has a spectrum closely matched to one of the pure components, while a lower score closer to zero, suggests an absence of that particular component.
Figure 2 shows an example spectrum for a specific particle, alongside reference spectra for the two active ingredients, and associated correlation scores. These scores suggest that this particle is a multi-component agglomerate (MCA), with clear spectral features associated with both APIs being observed within the particle’s spectrum. In a similar way, MCAs containing one or both APIs with lactose can also be identified.
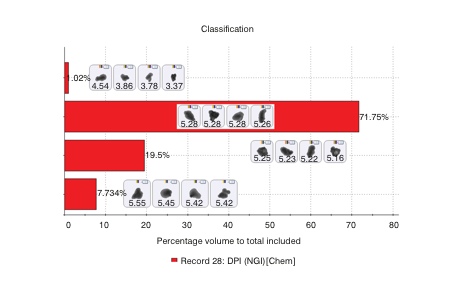
Figure 2: Comparing the Raman spectrum of individual particles with reference spectra for the APIs in the formulation enables secure chemical classification of the sample
Figure 3 shows chemical identification data for the entire particle population of interest. These data show that of the particles captured in stage 3, and subsequently classified as of interest, only around 1% are API 1 alone. The majority are API 2 but there are appreciable numbers of discrete lactose particles and multicomponent agglomerates. Example particle images are shown for each type of identified particle.
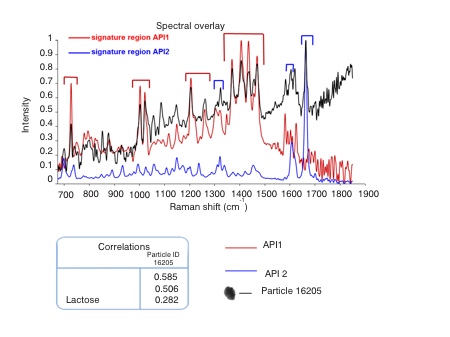
Figure 3: MDRS enables the precise classification of particles in an NGI sized fraction as being API, lactose or multicomponent agglomerates
These data provide far more insight into how the formulation is dispersed than does cascade impaction with HPLC, which simply generates averaged chemical compositions for each size fraction. For example, they show whether both of the APIs detach from the lactose with equal ease and whether or not the APIs are likely to co-locate in the lung, on the basis of their size. This information is extremely helpful for understanding how a DPI delivers clinical efficacy and in demonstrating bioequivalence.
Efficient de-formulation
De-formulation arguably presents an even greater challenge than formulation, most especially for complex products such as DPIs. Honing the analytical toolkit for DPI de-formulation is therefore essential. The traditional tools for inhaled product characterisation – cascade impaction and microscopy – have established benefits, but alternative techniques also have much to offer. Bringing speed and/or greater informational productivity, laser diffraction particle sizing, automated imaging and MDRS support the application of QbD and the efficient development of ANDAs.
References
1. http://online.wsj.com/news/articles/SB10001424052748703628204575618332675513808
2. www.fda.gov/downloads/Drugs/Guidances/ucm070573.pdf
3. Kippax et al, Proc. Drug Delivery to the Lungs 17, Edinburgh, 2006
4. Huck D., Kippax P., Virden A., et al. Drug Delivery to the Lungs 22, 2011, Conference Proceedings, 165-168