With ongoing improvements in automation, many aspects of the analysis can now be done without a great deal of input from the analyst; however, this does not make human input redundant as there are many skills that cannot be replicated by computer, reports Karen Spillman, Associate Director, Analytical Research and Development, Cambrex
When deciding to use LC/MS, it may not be as straightforward as preparing the sample for analysis and then choosing the most responsive mass-to-charge ratio on the instrument. The mass of interest can often only be identified by extracting each mass-to-charge ratio to distinguish the mass from the baseline, larger peaks in the spectra or coeluting impurities.
Changes in energy, heat, flow, polarity and even the source can be made to the mass spectrometer (MS) to ensure that an accurate analysis is achieved. Automation is a valuable tool in LC/MS analysis; at present, however, it cannot apply the level of scrutiny required to produce reliable results.
This article will examine the role that automation does play and highlight examples when an analyst is still essential. For the purposes of this article, it is assumed that the HPLC conditions are MS-compatible and can remain unaltered for analysis.
Automation has proven benefits in sample preparation, and instruments have been shown to be capable of accurately changing the sample concentration and even weighing and diluting samples. Sample preparation is critical during LC/MS analysis to ensure that the impurity of interest can be detected properly.
If it demonstrates good separation in the analytical method from other impurities and the main peak, the sample concentration or injection volume can be increased to produce a better response.
However, if the on-column concentration is increased, the sample should also be analysed at the nominal concentration, as the use of two concentrations helps to positively identify the peak by eliminating masses seen in both injections with the same response … and focus on masses that alter based on concentration.
When setting up an analysis on the LC/MS, automation can assist with all of these steps as it is recommended to
- always use the ultraviolet (UV) detector in line with the MS: in most cases, the analyst will use an existing HPLC-UV method in which the location of the impurity of interest is known. Keeping the UV in line with the MS allows the analyst to see the profile as it was viewed by HPLC-UV and allow easier identification of the peak of interest. Even if the impurity of interest does not have a chromophore and will not be visible using a UV detector, it is important to use this detector to eliminate false peaks in the baseline.
- run a blank of the diluent: the blank will help to establish the background of the MS analysis, showing the difference between the mass of interest and background noise. Most software systems can subtract this background for easier analysis.
- do at least two injections of each sample preparation: mass-to-charge ratios that can be attributed to a peak of interest will appear consistently. If the mass-to-charge only appears in one injection of one sample, this is not appropriate evidence of identification. It is possible to have a mass-to-charge ratio that is appropriate for the peak of interest that is not present in every sample, but this should only occur for peaks with a low MS response and the mass should appear in most of the samples to ensure proper identification.
- begin analysis in electrospray ionisation (ESI) mode: most compounds are detectable by ESI; and, whereas some systems require a manual change of detector type, other instruments have a multimode source that can be switched by the software.
- analyse the sample in positive and negative mode: for impurity detection, it is not recommended to use dual mode as this will divide the energy further and lower the detection abilities of the MS. Ideally, the analyst should programme the entire sequence in one mode, then switch to the other mode and reanalyse the sequence.
- set the scanning range from about one quarter to two times the estimated mass of the peak of interest: for a theoretical compound with the mass of 400, for example, the range would be set from 100–1000 m/z. If a main peak was 400, then the range may be set higher to allow for full examination of degradants and dimers that may form during the MS analysis. If a library is to be used, the mass may need to be set as low as 30–50 for better identification by the software.
- set some “typical” MS parameters for the laboratory for identification: it’s a good idea to always use the same starting point to ensure that identification was not missed because of a change in the procedure. The parameters can be changed after the first analysis if a mass cannot be found for the peak of interest.
After careful examination of the data, if the peak of interest cannot be extracted, the MS conditions should be altered to determine whether a change in energy, temperature or, lastly, the detection type will allow for the discovery of the peak.
On occasion, it may necessary to use a detector equipped with atmospheric-pressure chemical ionisation (APCI), which produces less fragmentation than ESI but requires more fine-tuning of the source parameters to achieve acceptable results.
Software systems are capable of generating a mass-to-charge ratio and comparing that with a programmed library, but if the compound is unknown or the scanning range was not sufficient, the identification will not be correct or possible.
To overcome this problem, software is available that will estimate related compounds from a proposed structure, but this relies heavily on input from the analyst of one or multiple structures and is not capable of knowing the process to produce the material and derive all the process-related compounds. For most peak identifications, the analyst is still needed to make informed decisions about the elution order, response and mass of the peak of interest.
Once the HPLC analysis is complete, the chromatograms must be scrutinised to ensure a positive identification is made. An ideal peak identification would show a well separated peak in the UV and MS chromatograms, and one large peak for the mass-to-charge ratio as in Figure 1 wherein the identification of peak 1 is determined to be 635.5 m/z in ESI negative mode.
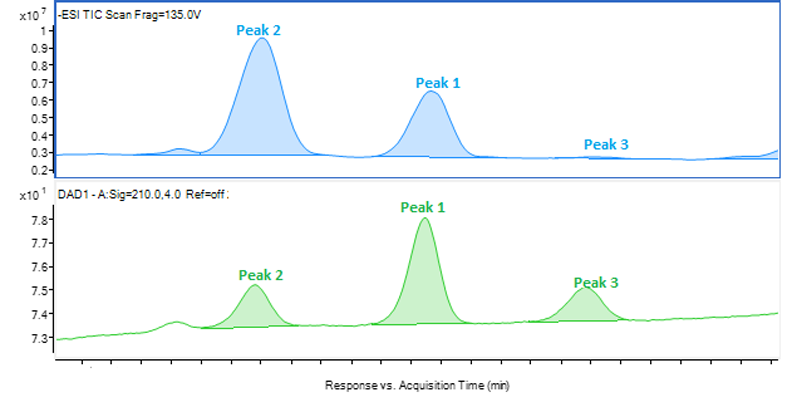
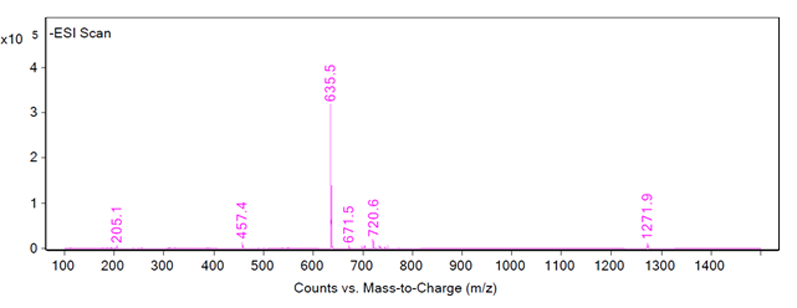
Figure 1: Chromatograms of peak 1 showing an LC/MS-ESI scan (top), an HPLC-UV scan (middle) and the fragmentation of peak 1 (bottom)
This type of identification can be completed by automation to recognise the best responding peak as the peak of interest. However, most peak identification is not so straightforward. Figures 2, 3 and 4 show three different example fragmentations in which peaks were identified and each of the example fragmentations highlights a different challenge that can be encountered during mass identification.
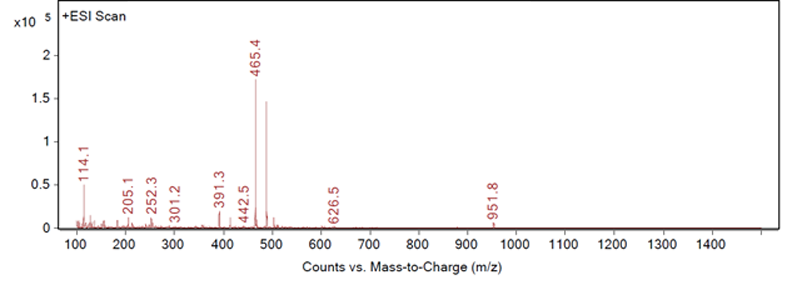
Figure 2: Fragmentation of a peak, example A
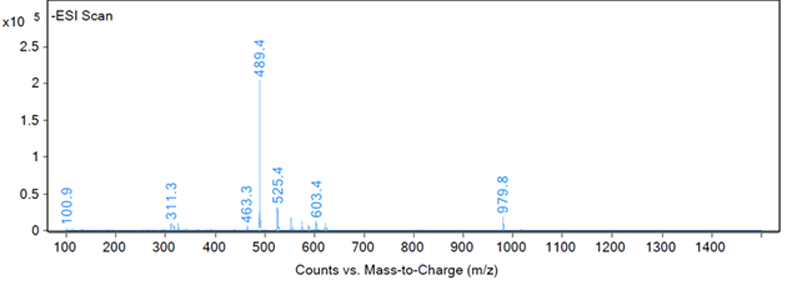
Figure 3: Fragmentation of a peak, example B
Figure 2 shows a large response at 465.4 m/z and 467.4 m/z, both of which are related to a neighbouring peak and not the impurity of interest. The third largest peak, 391.3 m/z, would then be a likely candidate for the identification of example A. An extraction of 391.3 m/z confirms that this mass-to-charge ratio is appropriate for the identification of example A as no other significant peaks are seen in the chromatogram with this mass (as shown in Figure 5).
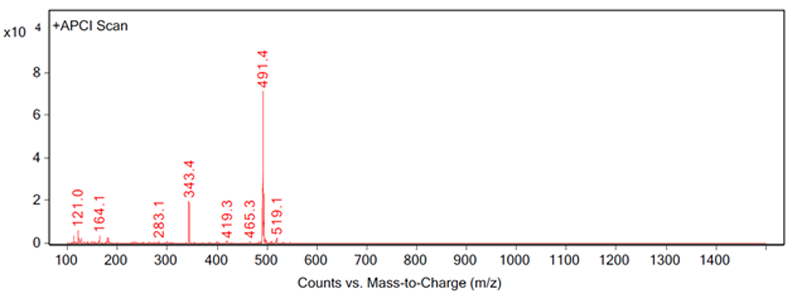
Figure 4: Fragmentation of a peak, example C
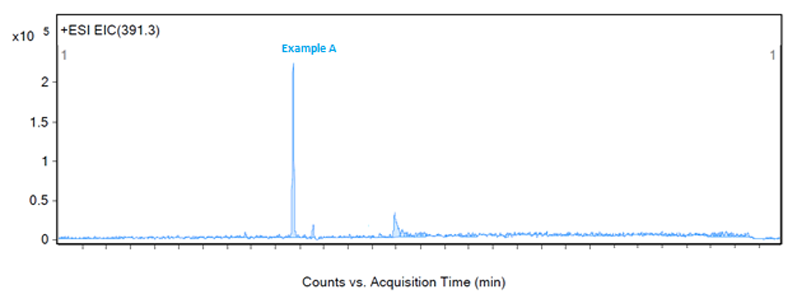
Figure 5: Extraction of example A at 391.3 m/z in ESI positive mode
It may be possible to programme software to ignore the peaks associated with the neighbouring one, but it would be become more difficult if the neighbouring peak is not a main or previously identified component, and if both peaks give good extracted chromatograms.
The peak of interest may also give a very poor response on the MS, and in Figure 3 a number of peaks are visible from 100–980 m/z, but an examination of the extractions by the analyst of these fragments revealed that all of the masses were related to neighbouring peaks or the baseline. The baseline of Figure 3 was examined to reveal a very small peak at 317.1 m/z, which was reproducible in other injections and samples and unique to the peak of interest.
However, the peak at 317.1 m/z does present a challenge as the response is low for an extraction — as shown in Figure 6 — which led to the peak not being detected in one of six injections. For a complete identification, the structure of the impurity must be theorised, the impurity obtained and injected. This is a situation when it would not have been possible for software to identify this low responding peak in this fragmentation.
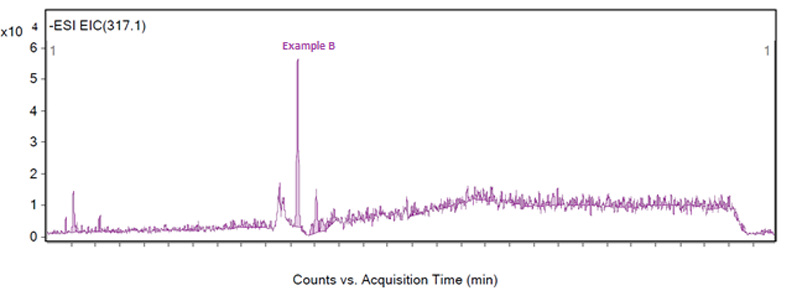
Figure 6: Extraction of example B at 317.1 m/z
Figure 4 shows a good example of complete identification. The peak was identified by extraction at 343.4 m/z, which was an expected impurity in the process. The impurity was prepared according to the method at the nominal concentration of the sample and it was spiked into three samples at 1% of the nominal concentration.
The spiked samples, impurity sample and a non-spiked sample were then analysed using the same MS conditions used to obtain the extraction at 343.4 m/z. This combination of samples allowed for analyses of mass and retention time by UV and MS to positively confirm the identification of the impurity.Further considerations
Although the MS can produce a theoretical mass, it is only possible to confirm the identity of the impurity with a comparison study of the peak obtained during mass identification and the impurity gathered from an outside source.
There are other challenges that may be encountered during mass identification, including no peak being visible in the MS chromatogram at the retention time of interest. In this instance, a fragmentation should still be produced and extraction performed as the MS can possibly reveal the desired mass without a visible peak.
Interference from neighbouring peaks is one of the most common problems, which is especially prevalent when a large main peak is close to the impurity of interest. When this is the case, the analyst must closely examine all the masses obtained during the MS scan and keep in mind that, as close eluting peaks, the masses are probably not very different and could even be chiral with the same mass.
It may be necessary to obtain fractions to completely separate the impurity from the interference and, if appropriate, a time-of-flight (TOF) mass spectrometer could be used, which can give a more exact mass and more precise separation of closely eluting peaks.
Mass identification by LC/MS can present many challenges that can be overcome by careful adjustment of the mass spectrometer parameters and examination of the data generated. The amount of data produced from a single sample in duplicate — analysed in both positive and negative mode — is significant and should be carefully inspected to ensure positive identification.
Although automation can assist with changes to the instrument, sample preparation and producing a mass-to-charge ratio, it requires an experienced analyst to determine the mass based on knowledge of the chemical process, related compounds and chromatographic conditions … and to confirm that identification with a spiking study.