Design of experiments (DoE) is becoming increasingly accepted in the pharmaceutical sector by manufacturers and regulators alike. The strategy involves a series of experiments that are designed to give statistically relevant information about multiple factors involved in the process at the same time, rather than relying on a large number of individual experiments.
Not only does it have the potential to save significant time and costs in the short-term, DoE allows the optimum conditions to be established rapidly, moving a project into the manufacturing plant more quickly.
Applying statistical tools and changing multiple factors simultaneously in premanufacturing experiments removes the need to run every permutation and combination of all the factors at different levels to determine the optimal conditions for production. DoE provides insight regarding individual factors, or a combination of factors, and how they affect the process.
DoE also highlights potential interactions between factors that might not normally be observed with a conventional one variable at a time (OVAT) approach. Synergistic effects — whether positive or negative — could otherwise be missed. By exploring different combinations of high, low and midpoints of all the relevant factors, it is possible to establish their interactions and how these can affect the experimental results.
There are three distinct phases of the DoE process: the screening model; the optimisation model; and robustness evaluation. The screening model is designed to identify which factors are statistically relevant to the process, whereas the optimisation model takes these factors and looks to improve the process by determining the best combination of conditions.
The robustness evaluation may be used to assess any sensitivity to small changes near the set points. A focus of efforts on the first two phases may provide a design space for regulatory filings.
The screening design
The screening design provides an assessment environment in which all the potential experimental variables are studied to determine whether they directly impact a quality attribute of the process.
Although the nature of these factors will always be process-specific, the list is likely to include inputs such as temperature, pressure, time, concentration, solvent, equivalents of reagents and the nature and degree of mixing in the vessel. Other relevant variables include those based on scale and the type of equipment being used.
Various different experimental designs can be applied, such as full factorial or fractional factorial, many of which employ a linear regression model. The selection of the appropriate screening design is driven by the number of relevant factors, the number of levels of each factor, the power of the design, process-specific details and the ease of performing the experiments.
The primary objective is to identify variables that are not statistically relevant to the experimental result to reduce the complexity of the models. If a particular variable is deemed not to affect the outcome of the process, it is set and no further development will be required for that variable. This allows the other identified variables to be changed around it.
Risk-based analysis
Every company has its own approach to the risk-based analysis that underpins its DoE strategy. The method developed at Cambrex starts with a multidisciplinary brainstorming session to identify different factors and the quality attributes that may be important to the process.
The brainstorming group of 5–7 people includes both those who have an intimate knowledge of the process to be studied and those with expertise in the implementation of DoE methodology. The initial list will almost certainly include too many factors; therefore, the next step is to reduce the design space to the most relevant factors for a screening study.
Each individual in the group will rank all the factors in the list in terms of how they may affect the various quality attributes on a scale of 1 to 5. Any factors that rank above 3 are deemed important, with those 4 and above being the most important.
The quality attributes are similarly ranked, which can provide insight into which are critical quality attributes (CQAs). These subjective rankings are averaged across the group, with the average values for factor contribution multiplied by the average values for quality attributes. The result is a consensus list that’s used to recommend which factors and quality attributes ought to be included in the DoE.
For this strategy to work, it is important that there is already some process knowledge regarding potential factors and CQAs. This might be from initial scouting runs in the laboratory or a report describing the work already undertaken. In the example highlighted in Table I, the summary of weighted factor responses for two CQAs indicates the relative importance of the factors.
The most important, highlighted in red, should be included in the screening DoE study. Careful consideration should also be given to those deemed to be of intermediate importance, coloured yellow, and whether they should also be included.
Prior to starting the screening experiments, additional factors may be added to the screening study. Once the screening design has been set, further controlled factors may not be added to the same study. Uncontrolled factors can be added later, as long as the data are collected at the time of experimentation. Examples of uncontrolled factors are the potency of commercial reagents or advantageous water levels in a hygroscopic reaction mixture.
The next step is to utilise the selected factors and quality attributes to generate an experimental design for the screening study. This considers both the number of factors and the type of design that is required. For example, a full factorial design will require many more experiments, whereas a fractional factorial design pulls out some of them to give a statistically relevant model with a reduced number of experiments.
Once the screening study is completed, the data gleaned produce a model for each response (CQA) to identify those factors for which changes are likely to be relevant. This should significantly narrow the list of factors included in the subsequent optimisation study.
Figure 1 shows the coefficients plot for the example screening model. The magnitude of the factor influence on the response (conversion or purity) is represented by the bar graph.
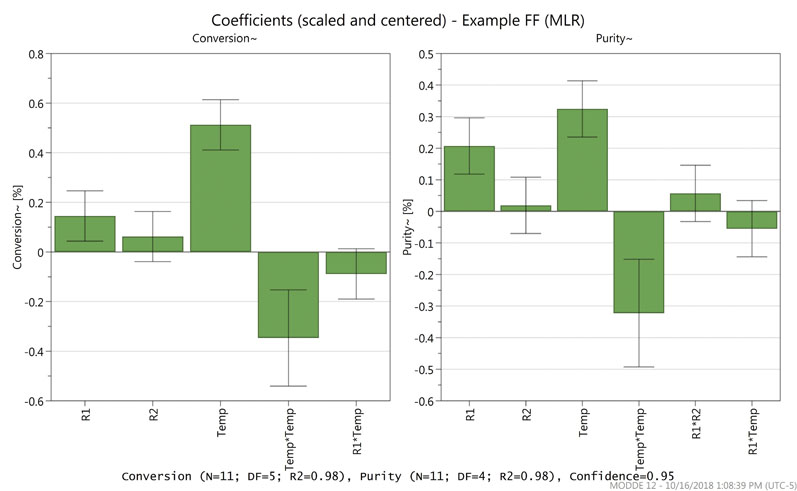
Figure 1: A coefficients plot for an experimental screening model
Comparing the bar graph with the standard error bar allows the determination of statistically relevant factors. In this screening study, reagent 1 (R1) and temperature were both deemed significant for conversion and purity, whereas reagent 2 (R2) was not. Thus, the study moved into the optimisation phase with just two factors.
During data analysis, it was also noted that a square term, shown in the figure as Temp*Temp, also contributed to the responses. Interaction terms (such as R1*R2 or R1*Temp) were evaluated but not significant in this case.
Optimisation design
The aim of the optimisation design stage is to look in greater depth at the factors to give a better understanding of the whole design space … and set the optimal conditions for the process in the manufacturing plant. Compared with screening studies, the optimisation study uses a quadratic regression model to provide much more detail by allowing full characterisation of the potential square terms and cross terms.
Instead of simply identifying that a factor is relevant for a given response, insight is gained into the nature of that relevance.
The procedure then takes each of the relevant factors identified in the screening study into the optimisation design to quantify acceptable ranges. Importantly, they will also be included in the filings that will ultimately be submitted to regulatory agencies. If it is possible to quantify how the factors affect the quality attributes of the process, then it will allow definition of the design space, critical process parameters (CPPs) and proven acceptable ranges (PARs) that will give predictable results.
The software, again, will generate the experiments that should be run in the optimisation study. This takes both the number of factors and the type of design that is required into account. Often, Central Composite Designs (CCDs) are employed; this second model is much more in-depth than the initial screening model, allowing for additional statistical analysis. It becomes possible to predict what is likely to occur in future experiments and removes any presumption when setting reaction conditions.
The software will generate the likelihood that target quality attributes will be met with various combinations of factors and gives the probability of failure. This information cannot be gleaned from the screening studies, owing to the use of simplified regression models. After generating an optimisation model, reaction conditions can be identified to obtain the desired quality attributes and reduce the risk of failure.
Figure 2 shows the coefficients plot for the example optimisation model. In this example, the quadratic regression model showed that reagent 1 (R1) has a smaller impact on the studied attributes than temperature, including a non-linear contribution of temperature.
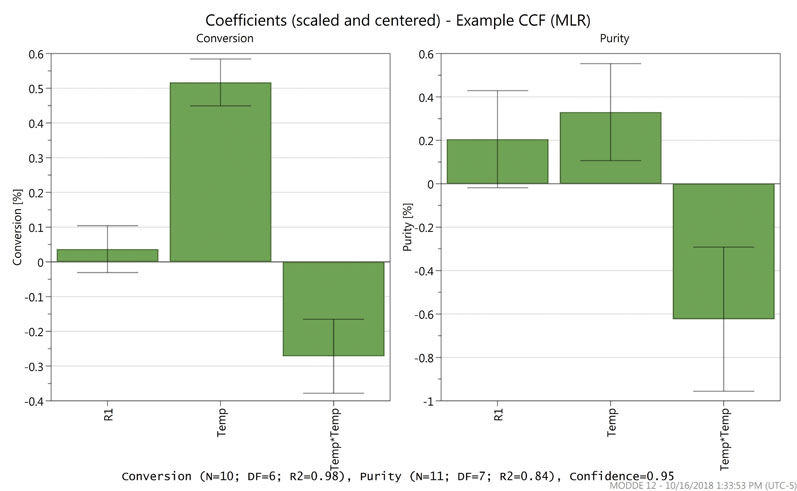
Figure 2: A coefficients plot for an optimisation model
The generated model is predictive and therefore capable of extrapolating outside the factor ranges that were studied experimentally. The software gives the option to optimise factor set points based on quality attributes (maximum, minimum or target).
Optimisation DoE models also allow a design space plot to be generated. In the example, Figure 3 shows the optimal working ranges across a temperature range of 18–28 °C and quantities of reagent 1, ranging from 65–135 mole equivalents, with a minimum purity of 97.5% and a minimum conversion of 98.5%.
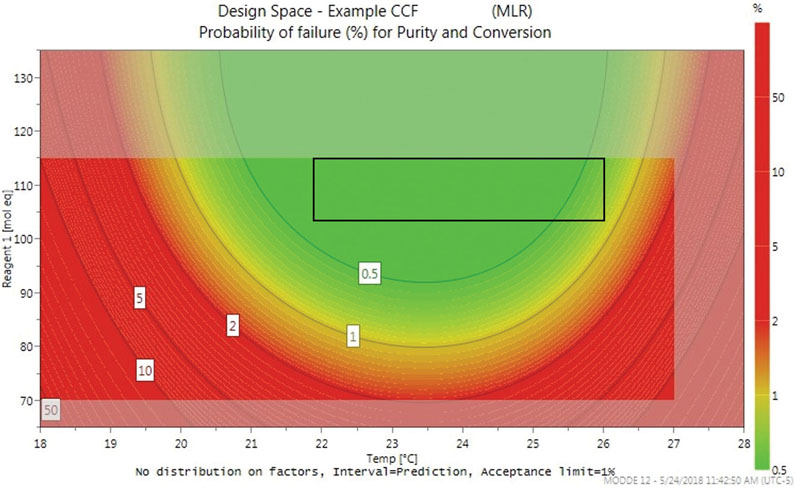
Figure 3: An example design space plot
The greyed-out areas at the edges of the plot are predictive, whereas the green zone shows factor combinations wherein the risk of failure to meet criteria is lower than 0.5%. As the risk increases, indicated by the contour lines, the colour transitions from green to red. Based on the design space and optimiser, it was recommended that the reaction should be run at 24 ± 2 °C, and with 115 ± 10 mole equivalents of reagent 1.
At this point, it can be the end of the DoE process, with conditions being implemented in the manufacturing plant. However, potential follow-up work may include verification trials, single variable experiments for factors that do not fit a DoE model or robustness evaluations.
DoE advantages
DoE has multiple advantages above and beyond simple time and cost savings. It gives an insight into how changes to one variable might affect the optimal point for other variables. Synergies are not always obvious from traditional/single experiments and it’s easy to miss how different factors affect each other.
It also makes non-linear effects clearer. Development efforts can be focused on those parts of the process that are actually important, without wasting time and resources on studying something with little or no impact. The statistical analysis can then be used to justify to regulators why a factor was deemed unimportant.
By establishing a proven acceptable range, it will become clear whether the material is likely to be compromised if the process goes outside the target operating window.
Establishing a design space allows the full range of outcome-specific parameters to be optimised and identifies the edges of failure for the process. The result will be a more predictable manufacturing process with significant savings in both cost and time.