
Effective risk mitigation is crucial for process robustness and long-term supply reliability. In chemical and pharmaceutical development, increased risk will eventually lead to higher costs, delays or unplanned investigations.
A key principle is that risk within a process is mostly conserved.
Narrowing a specification limit without improving the underlying process does not eliminate risk; it merely transfers it.
In practice, this often turns a quality risk into a business or supply one by raising the probability of failure (PoF), reports Lukas Brändli, Manager PR&D at CARBOGEN AMCIS.
Mitigating risk effectively requires a holistic and data-driven approach. Process capability, specification limits, downstream quality requirements, regulatory expectations and acceptable levels of residual risk must be considered together.
Only when these are aligned can teams reduce unnecessary constraints, avoid unpredictable failure modes and implement control strategies that support consistent performance throughout a product's lifecycle.
Removing unnecessary constraints to reduce risk
One of the most effective ways to lower risk is to eliminate constraints that lack a scientific basis.
When establishing or refining a control strategy, specification limits should be set as broadly as possible — as long as they remain compatible with process capabilities, downstream requirements and regulatory guidance. Broader specifications directly reduce the PoF.
In many cases, broader limits can be justified by demonstrating that lower intermediate quality remains acceptable in downstream steps, such as when supported by fate and purge behaviour.

When purge data are limited or unavailable, stress testing or deliberate impurity spike experiments can provide valuable evidence of impurity clearance.
A common starting point is to select spike levels at, or slightly above, the PoF-based specification limit, ensuring the generated data stay relevant for risk assessment.
When expanding specifications is not feasible, owing to regulatory constraints, safety considerations or downstream sensitivity, process optimisation should be considered.
Development work is justified when the expected cost related to business or supply risk, guided by PoF, exceeds the cost of optimisation activities.
In all instances, representative data and robust evaluation methods form the foundation of credible decisions.
Why rigorous quantification matters
Effective risk quantification relies on representative, high-quality data and a structured evaluation framework.
At CARBOGEN AMCIS, this led to the introduction of criticality based process data evaluation in 2019 and the subsequent development of the Python-based “critApp” data-evaluation platform.
Together, an understanding of criticality, probability of failure, fate and purge offers a strong and complementary foundation when it comes to identifying, understanding and mitigating risks throughout every stage of the lifecycle.
Criticality: a high-level metric for quality impact
Criticality based process data evaluation was introduced to help process chemists to navigate extensive, multidimensional datasets that can be difficult to interpret.
Implemented within critApp, the methodology allows analytical results to be normalised against specification limits.
At the centre of the approach is the criticality plot (Figure 1), which offers an intuitive, high-level overview of how experimental conditions and process parameters affect quality attributes within a dataset.1
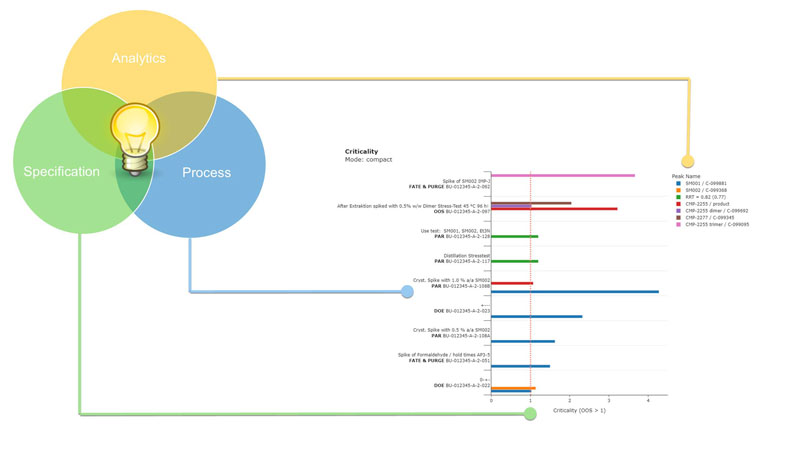
Figure 1: Criticality compares numerical quality attributes with their normalised specification limits; filtering for criticality values of >1 highlights experiments, parameters and quality attributes with the greatest quality impact, thereby guiding targeted risk mitigation.
What criticality reveals
Criticality highlights which impurities or quality attributes have the most significant influence on product quality.
It acts as an effective filter to better understand where variation is meaningful and where focus should be directed.
Beyond identifying impurities with the greatest impact, criticality functions as a structured tool to classify process parameter levels based on their proven influence on quality, as follows:
- experiments with a criticality of ≤1 dynamically define the proven acceptable range (PAR) based on actual performance within specification
- experiments with a criticality of >1 indicate that one or more process parameters lie outside the empirically supported PAR.
In such situations, critApp automatically summarises the parameters associated with critical experiments.
These factors are flagged because they may represent potential root causes for observed out-of-specification (OOS) behaviour.
This ability to automatically identify and map potential root causes is one of criticality’s most significant contributions.2
Criticality as a dynamic filter
In practice, criticality functions as a dynamic filter that connects process parameters and experimental outcomes based on their quality impact.
Instead of manually sifting through datasets and categorising them systematically, the tool enables chemists to navigate and interrogate complex data with clarity and efficiency.
Probability of failure: aligning process and specifications with tolerated risk
Although criticality emphasises visible quality risks based on observed critical or OOS experiments, the absence of such events does not imply that residual risk is non-existent.
Some risks remain concealed within the underlying data variability.
Systematic evaluation of the PoF helps to identify these hidden risks. PoF indicates the likelihood that a quality attribute will exceed its specification limit, based on both the available data and the statistical distribution used to model it.
Attributes with a PoF above the tolerated threshold are summarised by critApp in an excessive risk plot (Figure 2).
These attributes require further assessment (Figure 3) as part of a risk-mitigation strategy, which may involve adjusting specification limits, conducting stress tests or fate and purge studies, or exploring process improvements.
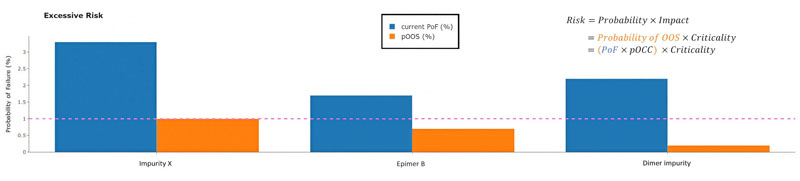
Figure 2: Impurities with PoF values above the tolerated threshold (dashed line) exceed the acceptable residual-risk level based on current specification limits and data variability. These impurities should be prioritised for further risk assessment. PoF represents a conservative, worst-case view because it includes only data points above the quantification or reporting limit. As many impurities appear only intermittently, the probability of triggering an actual OOS result (pOOS) is often lower. pOOS is calculated as PoF multiplied by the probability of occurrence (pOCC), which incorporates uncritical samples below the reporting limit.
Risk-based specification limits
PoF offers a practical way to align specification limits with an acceptable residual risk level.3 This approach accounts for data uncertainty, provided the dataset is representative, and the probability distribution is correctly selected (Figure 3).4
PoF is calculated as the area of the probability density function (PDF) that exceeds a specified limit. Conversely, the PDF can be used to find the specification limit associated with a target PoF.
In the PoF plot (Figure 3), the risk-based specification limit indicates the tolerated PoF selected by the process chemist or project team.
For attributes when the observed PoF exceeds the tolerated threshold (Figure 2), the current specification limit (blue) is more restrictive than the PoF-based limit (pink), indicating misalignment between risk tolerance and either the specification setting or process capability.
Ideally, specification limits should sit at or beyond the PoF-based limit to ensure consistency with the accepted residual-risk threshold.
When considering a wider specification, a suitable impurity spike level to generate meaningful fate and purge data is typically just outside the PoF-based limit.
Following successful process improvements, the dataset should be filtered to include only the updated results associated with the improved process.
critApp provides tools to compare these subsets and reassess PoF to confirm that any residual risk has been reduced.1
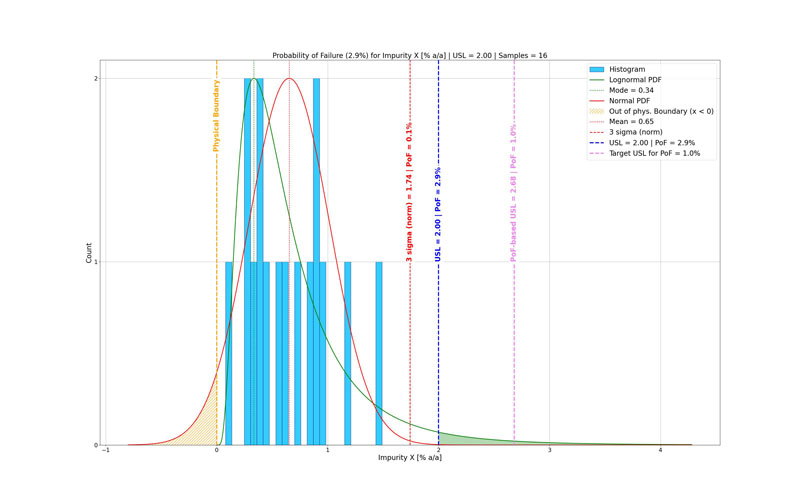
Figure 3: Probability of failure (PoF), based on a log-normal (green) probability density function (PDF), respects the physical boundary (yellow) of the data (light-blue histogram). The current upper specification limit (USL) at 2.0% a/a (blue) seems robust when evaluated against the normal distribution (red), but it does not meet the risk acceptance level (tolerated PoF = 1.0%) of the PoF-based upper specification limit at 2.68% a/a (pink).
Conclusion: probability density functions and physical boundaries
Further examination of Figure 3 shows that the likelihood of failure varies greatly depending on the probability density function (PDF) used for data evaluation.
It is often implicitly assumed that data follow a normal distribution (red curve) as described by the mean and standard deviation.
Under this assumption, a specification limit positioned three standard deviations (3σ) from the mean may seem to be reliable until the data and its boundaries are examined more closely.

A comparison with a log-normal distribution indicates that the probability of failure could be substantially underestimated when relying solely on a normal distribution.
This is because the normal PDF assigns part of its probability density outside the physical boundaries of the data, such as to negative impurity levels (<0% a/a), which are impossible in reality.
A normal distribution can be suitable for unbounded data, such as assay values or when the mean is far from the lower boundary … but it is not appropriate for impurity data with a natural lower limit.5
In contrast, a log-normal distribution accounts for these physical boundaries and better reflects typical impurity behaviour.
For bounded datasets with narrow specification limits, often approximately 3σ from the mean in a normal distribution, the difference between normal-based PoF and log-normal-based PoF can be significant.
Underestimation by more than an order of magnitude is typical.
This mismatch can explain unexpected OOS events that occur during a product's lifecycle, even when limits seem statistically robust under the assumption of normality.
References
- www.carbogen-amcis.com/knowledge-base/articles/item/criticality-based-process-data-evaluation#.
- https://viewer.joomag.com/speciality-chemicals-magazine-jul-aug-2023/0680246001689105583/p16?short=.
- Safety-driven limits for final drug substances or any process safety parameters are excluded from this discussion; these are fixed by toxicology, clinical evidence, regulatory guidance or other binding requirements. In contrast, intermediate and in-process control (IPC) specifications generally offer flexibility within the regulatory framework during development when downstream impact is understood and controlled.
- Representative data should reflect current processes and analytical methods and be consistent with any relevant changes made during development. critApp allows datasets to be grouped by descriptors such as campaign, equipment or observations to visualise shifts in quality when process changes occur.
- At a distance of >3σ from the physical boundary, the normal and log-normal distributions typically overlap to a very high degree with the resulting PoF being practically identical for both distributions.