

A tablet batch begins to show a wider weight distribution.
Production reviews the press settings. Engineering checks the feeder and tooling. Formulation scientists revisit flow properties, lubrication and moisture. QA examines the batch record for interventions or environmental changes.
All are reasonable places to look.
Yet one question is often left until much later:
How much of the apparent variation was introduced by the weighing system itself?
Weight data can provide a highly useful view of tablet and capsule process behaviour. It can reveal drift, excessive spread, outliers and distinct product populations that would be difficult to identify from an average alone. That value depends on the measurement system being capable of distinguishing genuine product variation from its own measurement uncertainty.
A checkweigher that lacks sufficient repeatability can make a consistent batch appear unstable. It can move otherwise acceptable units across a classification limit, inflate reject rates and direct an investigation towards a manufacturing process that may not have changed as much as the data suggests.
Before relying on a weight distribution to explain the process, manufacturers need confidence that the measuring system is not materially reshaping the picture.
Every weight result contains more than the product weight
No measurement system produces a completely perfect result.
The displayed value contains the actual weight of the tablet or capsule, together with some contribution from the measurement process. That contribution may be very small and operationally insignificant. It may also be large enough to influence classification decisions.
In simplified statistical terms, and assuming the sources of variation are independent:

Observed variance = product variance + measurement-system variance
The distinction is important.
Imagine a tablet population with a genuine standard deviation of 0.40 mg. If the weighing system contributes a standard deviation of 0.30 mg, the observed standard deviation becomes approximately 0.50 mg.
The recorded population appears 25% wider even though the tablets themselves have not changed.
That is an illustrative calculation rather than a proposed acceptance criterion. The acceptable relationship between product tolerance and measurement capability will depend on the application, the product risk and the decisions being made from the data.
The underlying principle remains consistent: measurement variation does not sit separately from the result. It becomes part of the result.
NIST guidance on measurement -process characterisation treats repeatability, reproducibility, stability, bias and uncertainty as properties that must be understood if measurements are to support reliable decisions.
A wider curve does not always mean a wider process
Weight -distribution patterns can tell an OSD team a great deal.
A widening curve may indicate inconsistent die fill, changing powder flow, feeder instability, moisture variation or mechanical wear. An off -centre curve may point towards a systematic shift. A bimodal distribution may suggest that two different process conditions have contributed units to the same batch.
Those interpretations are valuable, but only when the measurement system has sufficient capability to show the process faithfully. Your existing work on distribution patterns already demonstrates how much meaning can be drawn from changes in shape, position and spread.
Measurement -system behaviour can create similar visual effects:
- poor repeatability can widen the distribution;
- bias can move the apparent mean;
- drift can create a time -dependent shift;
- inadequate resolution can group results into artificial steps;
- inconsistent product presentation can add sporadic outliers;
- environmental interference can increase apparent variability
A distribution chart may therefore describe the product, the measurement system or a combination of both.
That does not reduce the value of weight data. It reinforces the need to establish how much confidence can reasonably be placed in it.
Why calibration alone may not answer the question
A current calibration certificate is essential, but it does not automatically prove that every measurement made during routine operation is sufficiently repeatable for the intended application.
Calibration normally establishes the relationship between instrument indications and traceable reference values under defined conditions. Operational measurement also involves product movement, presentation, vibration, airflow, static, settling time, contamination, software processing and the mechanical condition of the handling system.
A machine may indicate a reference weight accurately during a controlled check while still producing excessive variation when tablets or capsules are processed dynamically.
Repeatability asks a different question:
When the same unit is measured repeatedly under the same conditions, how closely do the results agree?
Reproducibility extends that assessment across changed conditions, such as different times, operators, machines or environments.
Stability considers whether performance remains consistent over time.
Bias examines whether results are systematically displaced from the reference value.
Resolution determines whether the system can show changes at the level needed for the application.
These characteristics are related, but they are not interchangeable.
USP General Chapter <41> requires the repeatability and accuracy of a balance to be appropriate for its intended use. European Pharmacopoeia Chapter 2.1.7 similarly emphasises repeatability and sensitivity as key performance characteristics for analytical balances. Those chapters apply to analytical weighing rather than directly specifying automated tablet and capsule checkweighers, but the wider metrological principle is relevant: equipment capability must be proportionate to the measurement decision it supports.
Measurement variation becomes commercially significant near an acceptance limit.
Consider a tablet whose actual weight is comfortably within the approved range but relatively close to the lower classification threshold. If the checkweigher has poor repeatability, repeated measurements of that same tablet may fall on both sides of the limit.
The product has not changed. The classification has.
Across a large batch, that behaviour can create:
- unnecessarily high reject rates;
- inconsistent results between repeated sorting runs;
- apparent differences between machines;
- disagreements between production and QC data;
- avoidable containment or investigation activity;
- loss of acceptable product.
The effect may be especially pronounced where the product is small, the permitted weight range is narrow or the business is attempting to make fine classifications within the accepted population.
Mini-tablets illustrate the scale problem clearly. A small absolute difference represents a much larger relative difference when the total unit weight is only a few milligrams. Static, fragments, dust and product handling also become more influential as the required measurement precision increases.
Manufacturers sometimes respond to measurement uncertainty by setting conservative internal limits well inside the product specification. That may reduce the risk of accepting a borderline unit, but it can also increase product giveaway and unnecessary rejection.
Improving measurement capability addresses the underlying problem more effectively than continually widening the safety margin around an uncertain result.
The opposite risk: false confidence
A noisy measurement system does not only create additional rejects.
It can also obscure the manufacturing signal.
Suppose a formulation or equipment adjustment reduces genuine tablet -weight variation by a relatively small amount. If the checkweigher contributes a similar or larger amount of variation, the improvement may be difficult to detect.
Development teams may conclude that the adjustment had little effect. Manufacturing may continue operating with a wider process window than necessary. A potentially useful improvement can be lost inside the measurement noise.
Low resolution creates a different problem. When results are rounded into relatively large increments, subtle movement may remain invisible until the process has shifted far enough to cross into the next displayed value.
Averages can remain particularly convincing under these conditions. The mean may appear stable while the measuring system is too insensitive or too variable to reveal meaningful changes within the population.
A capable system needs to do more than produce a plausible average. It must discriminate at the level required by the process question.
Why dynamic performance deserves closer attention
Automated tablet and capsule weighing is a dynamic operation.
Each unit must be separated, presented, stabilised, measured, classified and discharged while the machine continues to run. The time available for each measurement is limited, and the physical behaviour of the product can vary considerably.
A round coated tablet, an elongated capsule, a softgel and a 2 mm mini-tablet do not move in the same way. Product shape, surface finish, electrostatic charge, dust and fragments may all affect presentation.
Environmental conditions also influence high -precision weighing. Air movement, vibration, temperature, humidity and static charge can alter performance or prevent small units from moving consistently through the weighing path.
This makes equipment design part of measurement capability. The weigh cell cannot be assessed entirely in isolation from the feeding, handling and discharge system around it.
The practical question is therefore not simply:
How accurate is the weighing component?
It is:
How repeatably does the complete system measure this product, at the required operaing rate, under the conditions in which it will be used?
That is the result that affects the batch.
What a credible capability assessment should examine
A meaningful assessment should reflect the intended application rather than relying solely on a general machine specification.
For a tablet or capsule checkweigher, that may include repeated measurement of the same units, representative product weights across the working range and testing under realistic operating conditions.
The assessment should consider:
- short -term repeatability;
- performance at different points across the intended weight range;
- bias against suitable traceable references;
- stability over the duration of a run;
- sensitivity to changes in product presentation;
- static and environmental effects;
- performance at the intended throughput;
- consistency following cleaning, reassembly or adjustment;
- agreement between machines where more than one system is used.
The objective is not to create an unnecessarily elaborate study for every application. It is to understand whether the measurement contribution is small enough to support the decision being made.
A system used only to separate grossly incomplete capsules faces a different challenge from one used to characterise a tight mini-tablet population or divide acceptable tablets into narrow weight classifications.
The required capability should follow the application risk.
Measurement capability belongs in the investigation
When a batch displays unexpected variation, the weighing system should be considered alongside the process, material and environment.
That does not mean blaming the instrument whenever the distribution looks uncomfortable. It means treating measurement capability as a legitimate part of root -cause analysis.
Useful questions include:
- Has repeatability been confirmed using the actual product?
- Is the apparent spread consistent across repeated runs?
- Do the same units receive the same classification when reprocessed?
- Has performance changed since the previous service, cleaning or reassembly?
- Are static, vibration or environmental conditions within the established range?
- Does another capable system reproduce the same distribution?
- Is the instrument sufficiently precise relative to the acceptance or sorting limits?
These checks can prevent considerable time being spent investigating the wrong source.
FDA’s process-validation guidance places continuing emphasis on understanding and controlling sources of variability throughout the product lifecycle. A measurement system that influences the evidence used to judge that variability deserves to be included in that understanding.
Where precision weight sorting adds value
The strongest case for precision weight sorting is not simply that it identifies units outside a specified range.
Its wider value comes from producing weight data that is sufficiently repeatable to support better discrimination.
When the measurement contribution is low, teams gain a clearer view of:
- the genuine width of the product population;
- whether the process is centred;
- whether an adjustment improved performance;
- whether outliers are isolated or patterned;
- how much acceptable product is being lost close to a limit;
- whether a recovery or classification exercise can be conducted consistently.
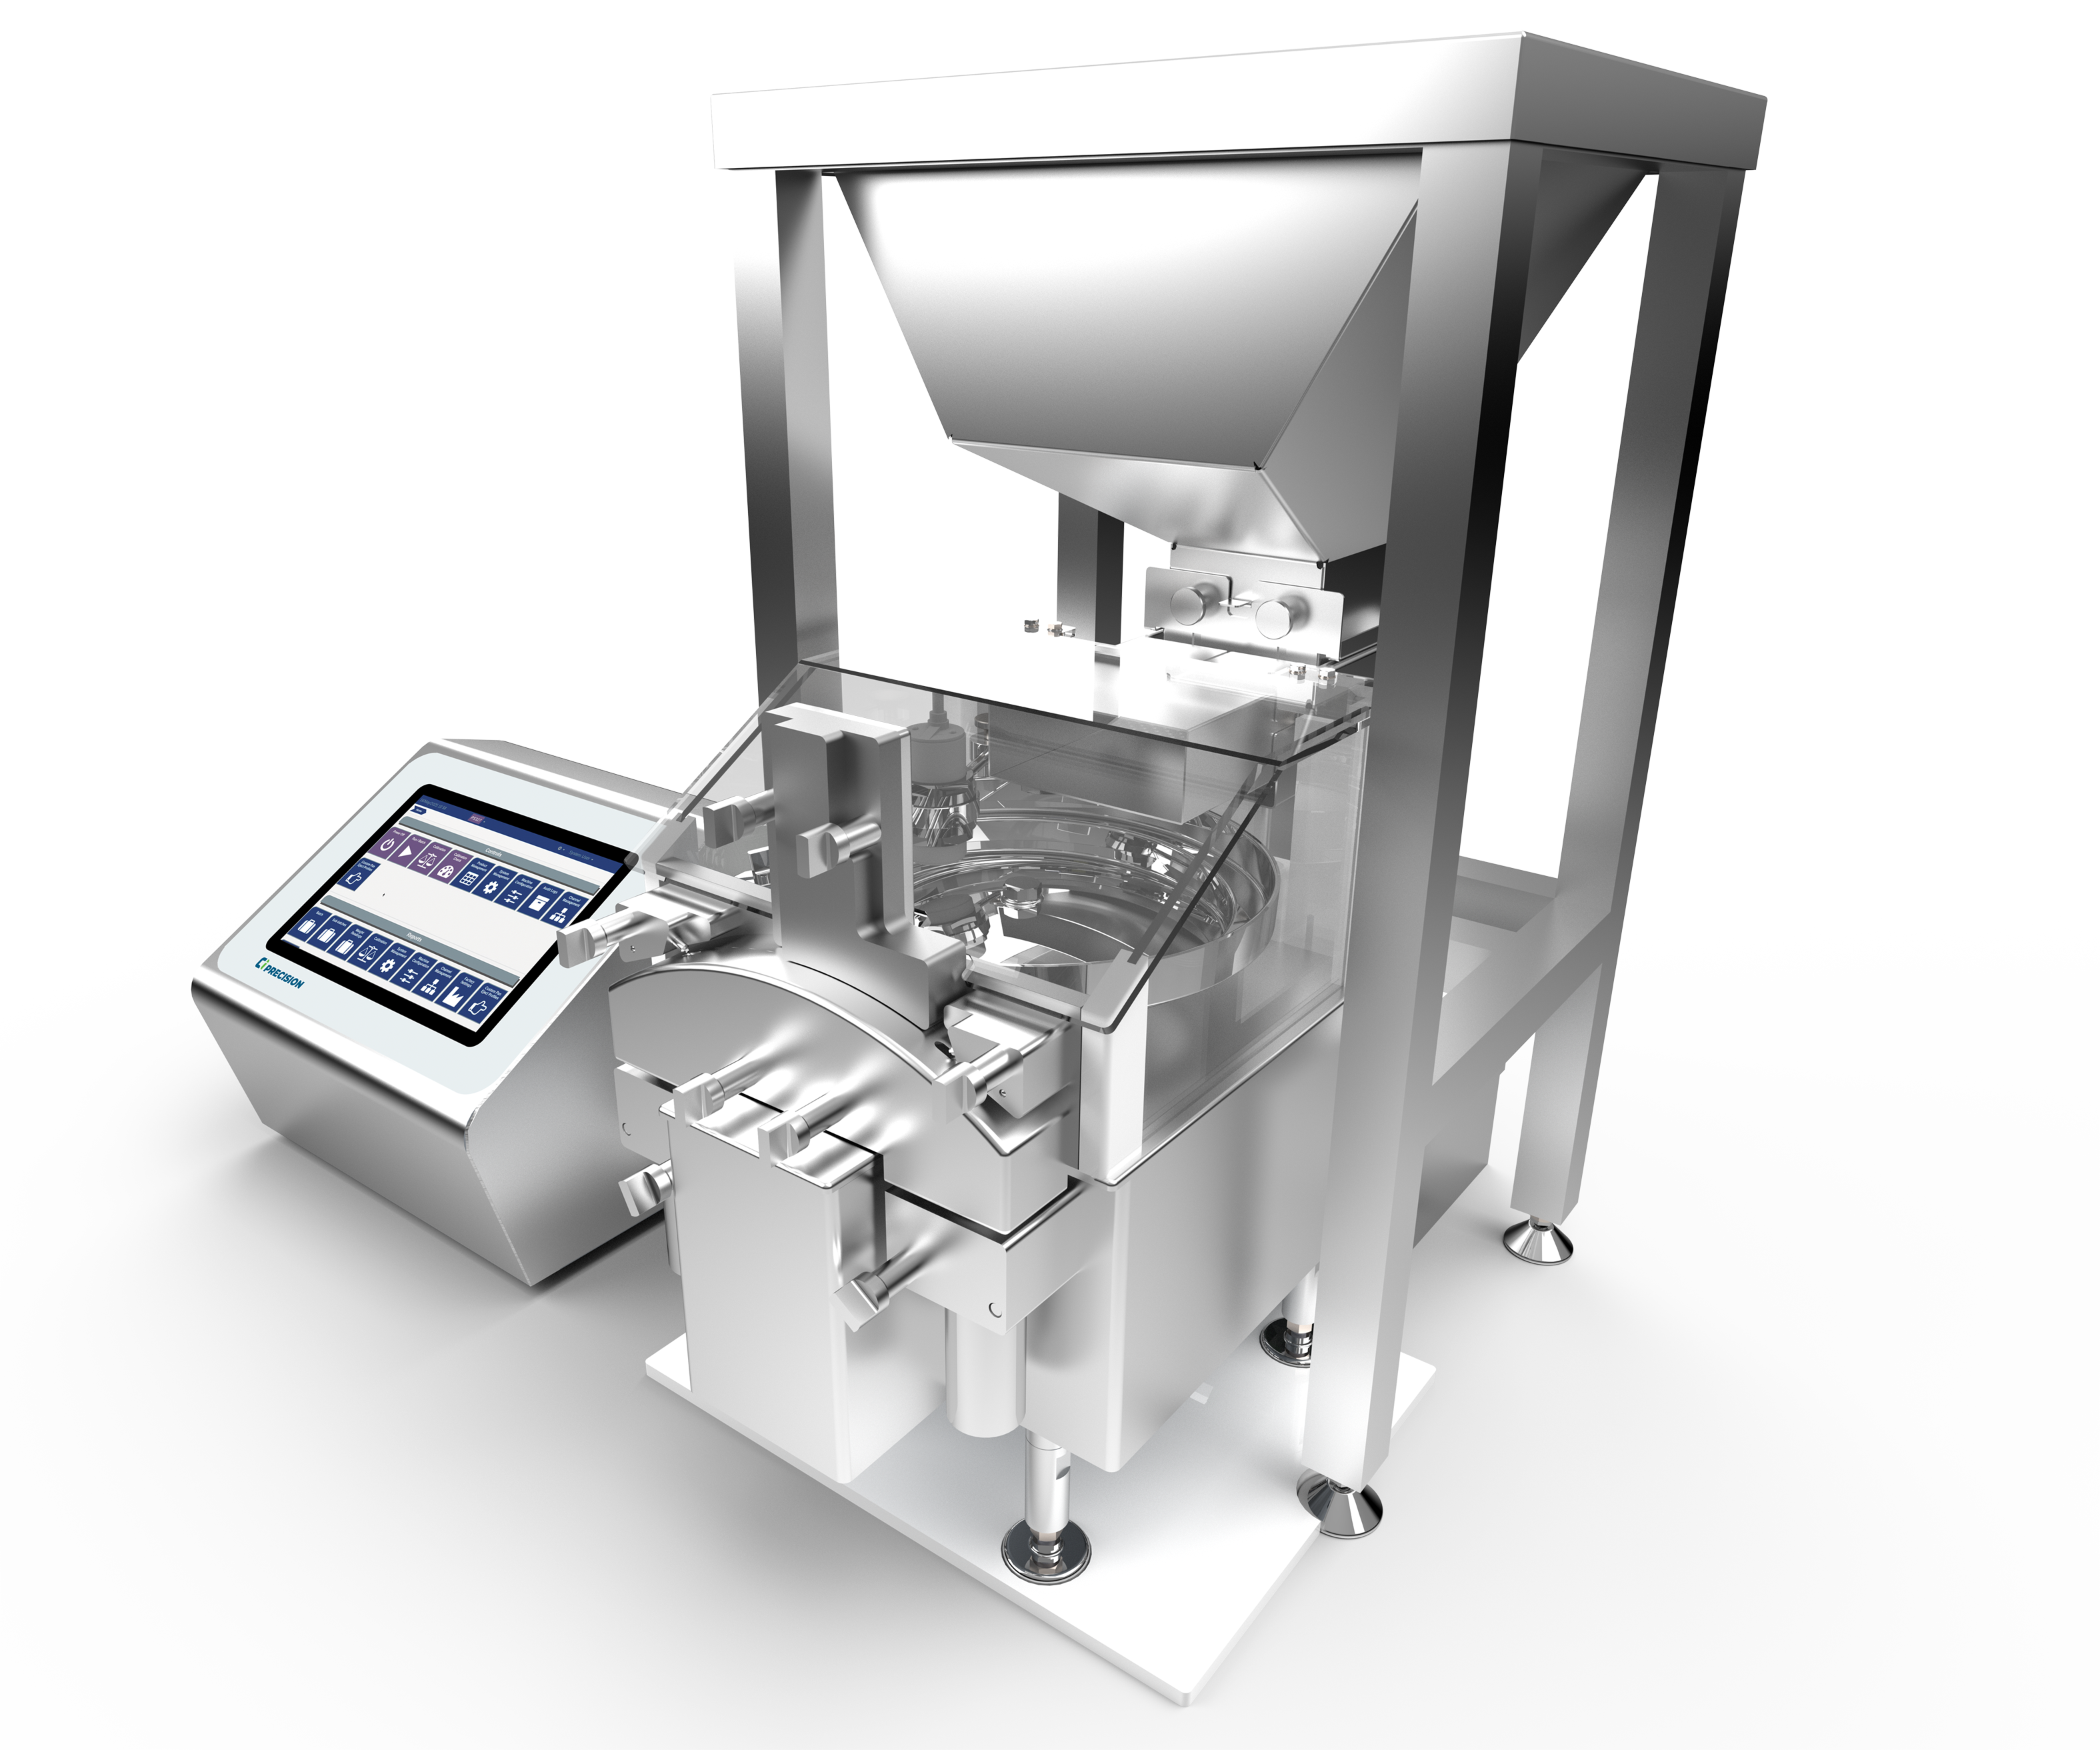
The SADE SP 60 Series is designed for high-precision, automated weighing and sorting of tablets, capsules, softgels and other solid dosage forms. Depending on the system configuration and application, repeatability is available down to ±0.3 mg, supported b y unit - level data recording, audit trails and defined weight classifications.
That level of capability is particularly relevant where conventional checkweighing performance would contribute too much variation relative to the product tolerance.
It allows the equipment to serve as more than a reject mechanism. It becomes credible source of process evidence.
Final thought
Weight data frequently influences significant decisions in OSD development and manufacture.
It can trigger an adjustment, support an investigation, justify containment, inform batch disposition or determine which units remain usable. Those decisions carry quality, operational and financial consequences.
The dataset should therefore be challenged before it is interpreted.
A distribution is only as trustworthy as the system that produced it. Where the measurement contribution is poorly understood, teams risk treating instrument behaviour as product behaviour.
Where capability is established and proportionate to the application, weight becomes a far more useful source of manufacturing intelligence.
When unexpected variation appears, how early does your investigation assess the checkweigher itself?
Sources
- NIST/SEMATECH Engineering Statistics Handbook, Chapter 2: Measurement Process
- Characterization.
- FDA, Process Validation: General Principles and Practices.
- USP General Chapter <41>, Balances, and <1251>, Weighing on an Analytical Balance.
- European Directorate the Quality of Medicines & HealthCare, Balances for Analytical Purposes , Ph. Eur. 2.1.7.